Manitoba Hydro Meltdown

Manitoba Hydro to shrink workforce by roughly 900 positions

Crown corporation cuts will follow immediate 30% reduction in executive team, management restructuring

hydro1

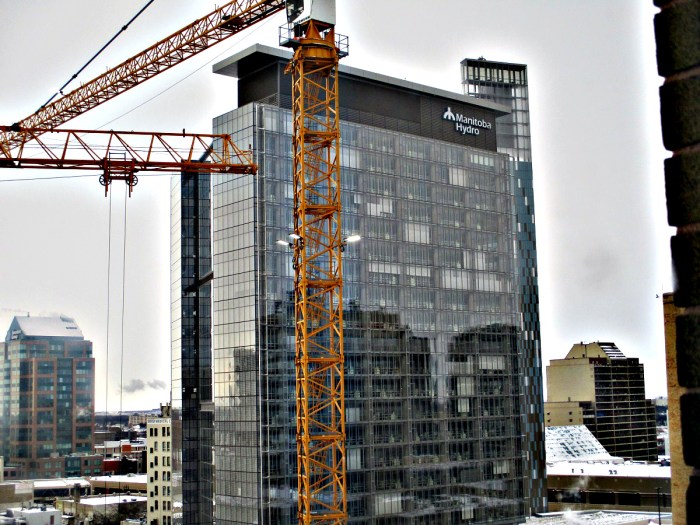
Manitoba Hydro will cut 900 positions across the province and will increase rates by at least 10 per cent, the Crown corporation announced Friday.

The utility, which employs about 6,200 people, plans to offer voluntary buyouts starting later this spring. The reduction amounts to a 15 per cent cut to Hydro’s total workforce.

“We care about our employees, so we’re going to work and try to make this as smooth and as fair as we can,” said Kelvin Shepherd, CEO and president of Manitoba Hydro. “I think our voluntary program will get some good results.”

Starting immediately, the number of executive positions will be reduced by 30 per cent. Three vice-presidents have already been let go, Shepherd said.

The hands-on workers

hydro1-2

Cuts to staff are necessary to protect the financial integrity of Manitoba Hydro, the chair of the Manitoba Hydro-Electric Board, Sandy Riley, said in a written statement.

Reducing costs will not only bolster Hydro’s financial future but can help protect Manitoba from future credit downgrades, he said.

Hydro’s debt was reported at $13 billion in October. Over the next three to four years, company debt could rise to $25 billion.

Some of the workers are getting out anyway they can.

crane77x

rappel

CEO Kevin Shepherd and the Manitoba Hydro board said cost reductions at the utility will not be enough to restore the Crown corporation’s fiscal outlook.

It is also planning “double-digit annual rate increases” for at least five years in order to re-establish “proper financial footing,” Riley said.

It is all so unreal!

hydro11

Groundhog Manitoba Merv sees his shadow and predicts six more weeks of winter, worse yet, Merv is a Dang Puppet!

merv

Just after sunrise, Manitoba Merv, the rodent forecaster at Oak Hammock Marsh Interpretive Centre made his Groundhog Day prediction, and it’s grim.

Merv saw his shadow, so Manitobans will have another six weeks of winter.

Oak Hammock Marsh staff say Merv’s predictions have been amazingly accurate.

For the past 23 years, Manitoba Merv has correctly predicted the arrival of spring and only made one error.

The groundhog may well be correct about this year’s prediction. Six weeks from now is mid-March, which is typically when the first geese return, Oak Hammock Marsh staff say.

mervv

I don’t trust groundhogs anyway, or gophers and badgers for that matter. All they’re doing is guessing. And more and more the guessing is being made by puppeteers.

mervz

Demographics in Manitoba

culture

The majority of Manitoba’s population (73 per cent) identifies English as their mother tongue, according to the 2011 Census. Other prevalent first languages are German (6 per cent), French (4 per cent), Tagalog (3 per cent), Cree (2 per cent) and Ukrainian (1 per cent).

According to the 2011 National Household Survey, about 72 per cent of Manitoba’s population is of European ethnic origin. Among this group, those who claim British Isle ancestry are the largest, followed by German, Ukrainian and French. Since the establishment of the New Iceland settlement on the western shore of Lake Winnipeg in 1875, Manitoba has also had a relatively large population with Icelandic origins (about 3 per cent). Those of Indigenous origin, including First Nations, Méti and a small number of Inuit, comprise roughly 17 per cent of the population. The province is also home to a large number of persons of Filipino and Chinese origins (5 per cent and 2 per cent respectively), concentrated primarily in Winnipeg.

The Canadian Museum for Human Rights Museum in downtown Winnipeg. July 3, 2012  (BORIS MINKEVICH / WINNIPEG FREE PRESS)

List of Manitoba’s 10 Largest Cities

Name Population
Winnipeg 663,617
Brandon 46,061
Springfield 14,069
Hanover 14,026
Steinbach 13,524
Thompson 13,123
Portage la Prairie 12,996
St. Andrews 11,875
Winkler 10,670
St. Clements 10,505


Population since 1871

1871 25,228
1881 62,260
1891 152,506
1901 255,211
1911 461,394
1921 610,118
1931 700,139
1941 729,744
1951 776,541
1956 850,040
1961 921,686
1966 963,066
1971 988,245
1976 1,021,505
1981 1,026,241
1986 1,063,015
1991 1,091,942
1996 1,113,898
2001 1,119,583
2006 1,148,401
2011 1,208,268