Montreal

| 2012 | 2013 | 2014 | 2015 | |
|---|---|---|---|---|
| persons (thousands) | ||||
| St. John’s (N.L.) | 205.9 | 209.1 | 212.3 | 214.3 |
| Halifax (N.S.) | 406.7 | 410.0 | 413.6 | 417.8 |
| Moncton (N.B.)1 | 142.8 | 144.4 | 146.1 | 148.0 |
| Saint John (N.B.) | 128.5 | 128.0 | 127.5 | 126.9 |
| Saguenay (Que.) | 160.0 | 160.3 | 160.4 | 160.0 |
| Québec (Que.) | 785.2 | 793.6 | 800.9 | 806.4 |
| Sherbrooke (Que.) | 207.5 | 210.1 | 212.6 | 214.5 |
| Trois-Rivières (Que.) | 154.4 | 155.1 | 156.0 | 156.4 |
| Montréal (Que.) | 3,937.4 | 3,985.1 | 4,028.0 | 4,060.7 |
| Ottawa-Gatineau (Ont.-Que.) | 1,288.5 | 1,302.9 | 1,316.5 | 1,332.0 |
| Kingston (Ont.) | 165.9 | 167.1 | 168.5 | 169.9 |
| Peterborough (Ont.)1 | 122.7 | 123.1 | 122.8 | 122.6 |
| Oshawa (Ont.) | 373.8 | 379.1 | 384.0 | 389.0 |
| Toronto (Ont.) | 5,868.7 | 5,966.4 | 6,053.4 | 6,129.9 |
| Hamilton (Ont.) | 750.7 | 758.3 | 765.2 | 771.7 |
| St. Catharines-Niagara (Ont.) | 404.0 | 405.2 | 406.8 | 408.2 |
| Kitchener-Cambridge-Waterloo (Ont.) | 498.8 | 503.1 | 507.3 | 511.3 |
| Brantford (Ont.)1 | 140.4 | 141.8 | 142.8 | 143.9 |
| Guelph (Ont.)1 | 148.0 | 149.5 | 151.3 | 153.0 |
| London (Ont.) | 494.4 | 498.7 | 502.7 | 506.4 |
| Windsor (Ont.) | 330.8 | 332.5 | 334.3 | 335.8 |
| Barrie (Ont.)1 | 195.4 | 198.0 | 200.3 | 202.7 |
| Greater Sudbury (Ont.) | 165.5 | 165.7 | 165.3 | 164.8 |
| Thunder Bay (Ont.) | 125.1 | 125.2 | 124.9 | 124.7 |
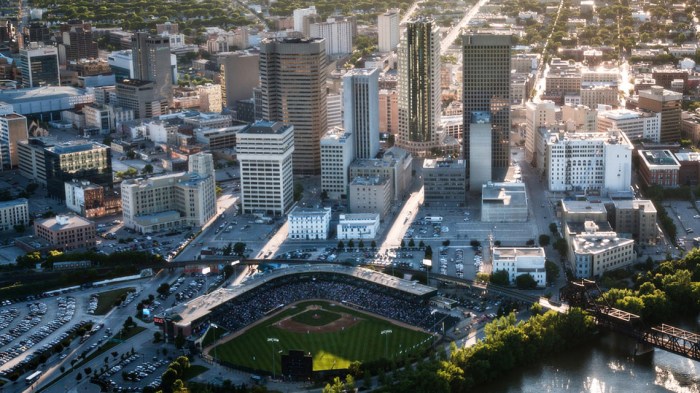
| Winnipeg (Man.) | 759.6 | 770.3 | 782.6 | 793.4 |
| Regina (Sask.) | 225.0 | 231.3 | 237.0 | 241.4 |
| Saskatoon (Sask.) | 281.4 | 291.0 | 298.9 | 305.0 |
| Calgary (Alta.) | 1,307.5 | 1,357.8 | 1,406.0 | 1,439.8 |
| Edmonton (Alta.) | 1,241.8 | 1,286.0 | 1,331.6 | 1,363.3 |
| Kelowna (B.C.)1 | 185.6 | 187.8 | 191.2 | 197.3 |
| Abbotsford-Mission (B.C.) | 176.7 | 178.5 | 181.0 | 183.5 |
| Vancouver (B.C.) | 2,408.1 | 2,438.7 | 2,475.7 | 2,504.3 |
| Victoria (B.C.) | 355.2 | 357.6 | 361.4 | 365.3 |
Calgary

Winnipeg
–


